 BOSTON MATRIX THEORY
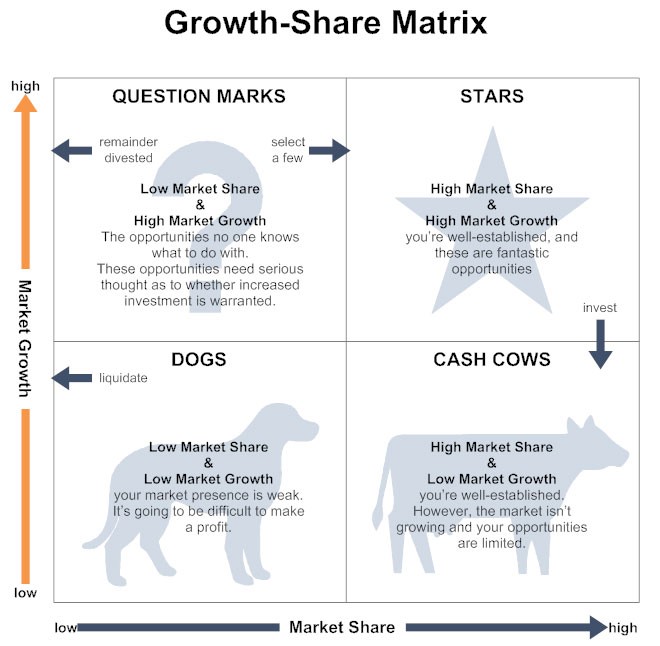
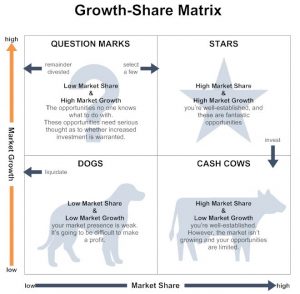
- A growth-share matrix, also known as a Boston, creates a visual assessment of products/investments in terms of relative market share and market growth rate. Each investment/product is plotted in 1 of 4 positions:
- Dogs – Low market share and a low growth rate. Product/investment with little or no potential.
- Question marks – describes an investment that is growing fast but is not necessarily generating a lot of revenue due to low market share. Also requires a large sum of investment to keep growing and under the right circumstance it can become a star, but without growth can quickly become a dog.
- Stars – High growth rate in a high growth market. They both make and consume large amounts of capital.
- Cash cows – High market share in a mature, low growth market. They generate more revenue than the resources they consume. They’re often used to fund new business ventures and help turn question marks into stars and potential future cash cows.